Home Insurance in Shenandoah County, Virginia
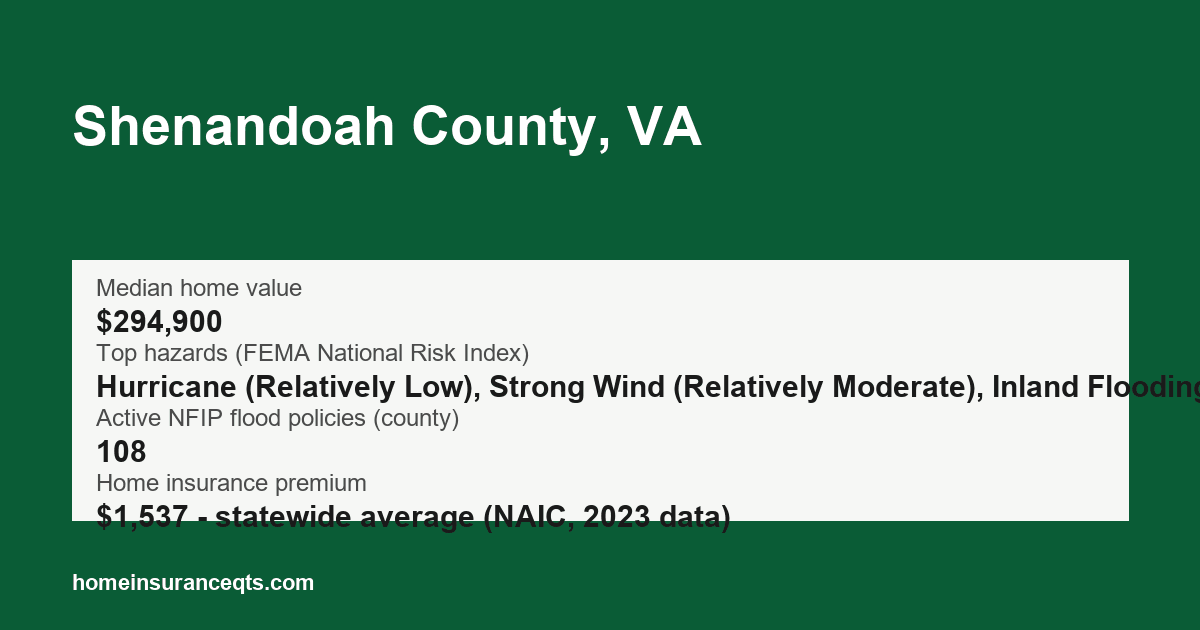
Homes in Shenandoah County carry a median value of $294,900 - 23% lower than the Virginia median.
The typical home in Shenandoah County was built around 1983. Older homes can cost more to insure or rebuild because of aging wiring, roofing and plumbing. About 22% of homes were built before 1960, about 3 points above Virginia's 19%.
In Shenandoah County, the housing stock is 83% single-family homes, 9% apartments in buildings with 5+ units and 4% mobile or manufactured homes. Mobile and manufactured homes typically need a manufactured-home (HO-7) policy rather than a standard homeowners policy.
In Shenandoah County, about 60% of owner-occupied homes have a mortgage - lenders require hazard insurance on every mortgaged home.
About 73% of occupied homes in Shenandoah County are owner-occupied. The vacancy rate is 16%; vacant or unoccupied homes typically need a different coverage form than an owner-occupied policy.
Most homes in Shenandoah County - 62% - are primarily heated with electricity. Homes heated with propane, fuel oil and wood can carry added fire risk. Fuel-tank leaks and spills are often excluded from standard homeowners policies.
FEMA's National Risk Index lists hurricane (Relatively Low), strong wind (Relatively Moderate) and inland flooding (Relatively Moderate) as the leading hazards for Shenandoah County.
As of September 2026, Shenandoah County has 108 active NFIP flood insurance policies. Standard homeowners insurance does not cover flood damage, so flood coverage needs a separate NFIP or private flood policy.
The statewide average premium for a standard HO-3 homeowners policy in Virginia is $1,537 per year, according to the NAIC homeowners insurance report (2023 data).
Key figures
| Median home value | $294,900 |
|---|---|
| Median year built | 1983 |
| Owner-occupied share | 73% |
| Share of owner-occupied homes with a mortgage | 60% |
| Top hazards (FEMA National Risk Index) | Hurricane (Relatively Low), Strong Wind (Relatively Moderate), Inland Flooding (Relatively Moderate) |
| Active NFIP flood policies (county) | 108 |
| Home insurance premium | $1,537 - statewide average (NAIC, 2023 data) |
Towns and cities
Smaller communities
-
Toms Brook
- Median home value: $226,800
- Median year built: 1939 or earlier
- Owner-occupied share: 73%
Sources
Data last updated: 2026-09-29
- U.S. Census Bureau Gazetteer Files (2024)
- U.S. Census Bureau, American Community Survey 2020-2024 5-Year Estimates (2024)
- FEMA National Risk Index (December 2025)
- FEMA OpenFEMA NFIP Redacted Policies v3 (2026)
- NAIC Dwelling Fire, Homeowners Owner-Occupied, and Homeowners Tenant and Condominium/Cooperative Unit Owners Insurance: Data for 2023 (published 2026) (2023)