Home Insurance in Riverbank, California
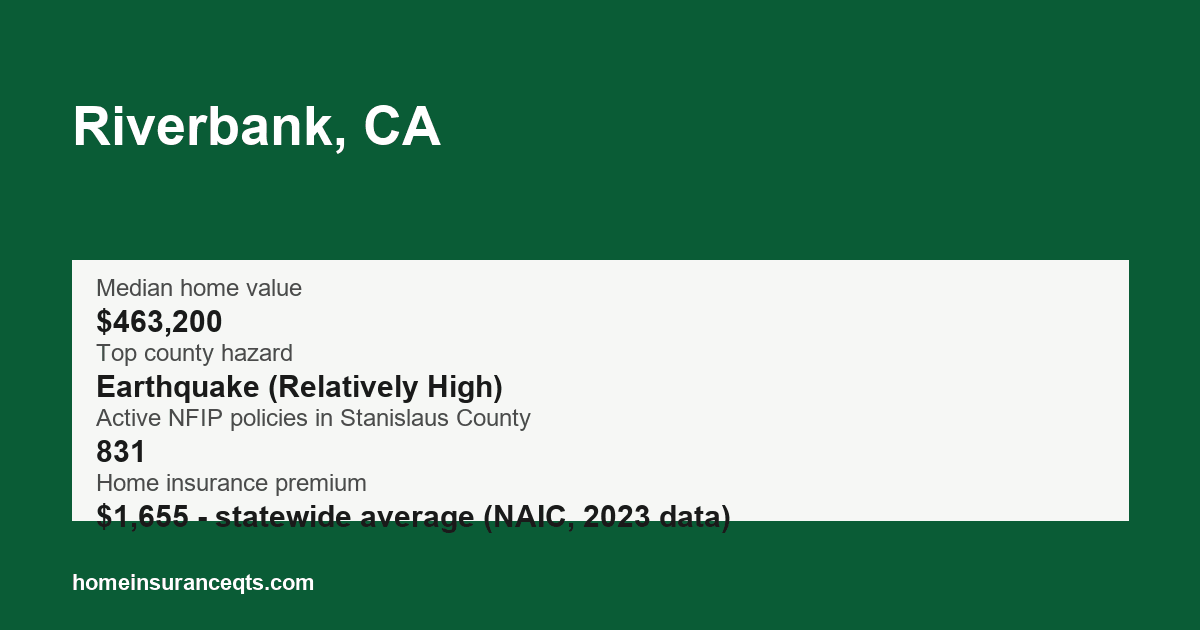
With a median home value of $463,200, Riverbank is close to the Stanislaus County median.
The typical home in Riverbank was built around 1996. About 9% of homes were built before 1960, about 10 points below Stanislaus County's 19%. Because older housing stock often has aging wiring, roofing or plumbing, it can cost more to insure or rebuild.
The housing stock in Riverbank is 89% single-family homes, 5% apartments in buildings with 5+ units and 4% mobile or manufactured homes. Mobile and manufactured homes typically need a manufactured-home (HO-7) policy rather than a standard homeowners policy.
70% of owner-occupied homes in Riverbank carry a mortgage, and mortgage lenders require hazard insurance for as long as the loan is active.
Riverbank has an owner-occupancy rate of 72% and a vacancy rate of 1%; unoccupied homes typically need a different coverage form.
70% of homes in Riverbank are primarily heated with natural gas.
Stanislaus County had 831 active NFIP flood policies as of September 2026. Its top FEMA-rated hazard is earthquake (Relatively High). See the full Stanislaus County home insurance overview for all FEMA hazard ratings and flood coverage details. Earthquake damage is excluded from a standard homeowners policy.
The statewide average premium for a standard HO-3 homeowners policy in California is $1,655 per year, according to the NAIC homeowners insurance report (2023 data).
Key figures
| Median home value | $463,200 |
|---|---|
| Median year built | 1996 |
| Owner-occupied share | 72% |
| Share of owner-occupied homes with a mortgage | 70% |
| Top county hazard | Earthquake (Relatively High) |
| Active NFIP policies in Stanislaus County | 831 |
| Home insurance premium | $1,655 - statewide average (NAIC, 2023 data) |
Nearby towns
Sources
Data last updated: 2026-09-29
- U.S. Census Bureau Gazetteer Files (2024)
- U.S. Census Bureau, American Community Survey 2020-2024 5-Year Estimates (2024)
- FEMA National Risk Index (December 2025)
- FEMA OpenFEMA NFIP Redacted Policies v3 (2026)
- NAIC Dwelling Fire, Homeowners Owner-Occupied, and Homeowners Tenant and Condominium/Cooperative Unit Owners Insurance: Data for 2023 (published 2026) (2023)